
What the pros use to monitor private wealth portfolios.
Investing is more than just choosing assets; it’s about monitoring performance to ensure that your investments align with your financial goals. Whether you’re a novice or a seasoned investor, acquiring the keys to assessing portfolio performance is crucial. This guide provides the tools to ask the right questions about portfolio performance, whether you manage your portfolio yourself or delegate the management to someone else.
In this article, you will understand:
- Performance calculation itself and the perverse effect of different Time-weighted methodologies. The same portfolio and same flows may provide different return numbers, leading to wrong analysis and bad decisions or even doubting your manager’s integrity.
- Relative Performance, or Alpha, and what it explains and doesn’t explain. In any walk of life, the ego gets in the way of common sense, and Alpha provides a nice test bed for ego management. How do you make sure it is presented sensibly?
- As soon as you invest or delegate the management of your wealth, you accept that, at some point, you will lose money. Losing in the short run to gain long-term is risk-taking. How is that measured? Is your manager using your “risk budget” efficiently? Risk aims to measure your probability of losing money and is a crucial feature of your manager’s efficacy. Does your asset manager correctly express your gains expectations with your acceptance of losses – in short, your risk appetite?
- Once performance is calculated correctly and risk adequately measured, we can combine performance and risk with the well-known Sharpe Ratio. As old as modern finance, this number can give vital insights into separating two managers with similar performances or a manager with a proper, well-defined, relevant benchmark. How can you exploit its insights when discussing performance with your manager?
1) Same portfolio, same period, different performance ?!?
Before any analysis, understanding time-weighted returns and the impact of inflows and outflows on performance is essential. And it’s pretty simple.
Return on Investment (ROI) is the ultimate measure of investment success. It evaluates an investment’s gain or loss in value relative to its cost. Taking into account inflows and outflows, a performance number is then calculated. To calculate your ROI accurately, it is crucial to consider withdrawals and additions to your portfolio.
For example, if your portfolio starts at €100,000, by the end of June, it has increased to €110’000.-, but you withdrew €10’000.- at the start of that period, your ROI is calculated as follows: 110’000 – (100’000 – 10’000) = 20’000.-. Therefore, your performance is 20’000 / 100’000 or +20%. However, if you withdrew at the end of the period, your ROI would be 110’000 – (110’000 – 10’000) = 10’000.-, or +10% performance. Proper accounting of your withdrawals (and additions) is essential.
But why?
Let’s take a more complex but staggering example. Performance for each period for the portfolio is as follows:
- January 1 to February 15: +5%
- February 15 to March 31: -5%
- March 31 to June 30: + 20%
We construct three scenarios with different dates for the same €10’000 withdrawal:
- February 15
- March 31
- June 30
Calculate the portfolios’ ROI and total return under these three scenarios.
‘Market Performance’ is the portfolio’s performance for the period; all else is equal. It includes all fees, dividends, accrued interests, capital gains and taxes. It compounds at 19.70%, with each period being +5%, -5% and +20%.
The Portfolio performance for each period is computed as follows.


As we can see, portfolio performance = market performance for each period. We have the same start value and the same performance for each period; we expect the end-of-period performance to be 19.70% for all three cases.
But wait… The end values are not the same! €108’300, €107’700, €109’700. The same returns but different values? Suppose we calculate the performance using these end values, the start value of €100’000 and the €10’000 withdrawals at each set scenario date. In that case, we get 18.3%, 17.7% and the market equivalent performance of 19.7%. But, please, WHY?!?
The methodology used to calculate performance assumes that the withdrawal is happening at the end of the period, which may not reflect reality. The actual amount you end up with depends on when you withdraw money and the performance generated on the remaining assets in subsequent periods. An inaccurate performance number, such as 18.3% or 17.7% instead of the correct 19.7%, can lead to incorrect conclusions.
Before making any comparisons, it’s crucial to understand how the performance was calculated. If you see any differences, it may not be due to someone lying to you but an approximation made to save computing time and data costs.
Performance numbers are the source of all metrics used, so if they are not perfectly accurate, they may not be comparable with other sources, and the analysis could be flawed, leading to wrong decisions.
- The proper way to compute performance is to use the daily value and inflow and outflow data to calculate the daily performance, also called daily time-weighted. This number is then compounded for the various periods required for analysis, providing the most accurate performance time series.
2) Alpha, the indicator of excess hubris?
Alpha indicates an investment’s excess return relative to a benchmark return. Suppose the benchmark is an adequate reference to compare the portfolio’s performance; the Alpha measures the excess return above the benchmark, also called outperformance or beating the market (chest pounding ensues).
In our extensive experience, underperformance, or negative Alpha, is typically not attributed by the manager to the quality of his work but to other external factors beyond his control (constraints, costs, bad luck, wrong benchmark). Don’t be fooled; Alpha has many factors, including luck, especially in the short term, but in the long run (3-5 years), you should expect your portfolio to attain or exceed a properly defined benchmark; otherwise, you may want to question why you hire a professional.
It’s also worth noting that market benchmarks or bespoke composite indices are less relevant for private wealth portfolios than actively managed portfolios. For example, Performance Watcher Indices uses daily data, and consultant Asset Risk Consulting uses monthly data. These two providers allow you to compare the portfolio to other managed portfolios, net of all fees.
3) Volatility is one critical measure of Risk. Comparing portfolios without considering their volatility makes no sense.
Standard Deviation is a metric that helps you understand the level of risk associated with your portfolio. It measures how much the returns deviate from the average over a specific period, which is commonly called “volatility.”
Let’s say you have two portfolios with a return of 21% for the quarter, which translates to a daily return of about 0.29%.
Now let’s say we have a “3% portfolio” with a 3% volatility, with a range of return around that average of +/- 0.5%, i.e. between +0.8% and -0.2 %.
The “12% Portfolio” had a +/—2% range, between +2.3% and -1.7% daily returns.
Although both portfolios have the same compounded performance by the end of the quarter, they take very different paths and risks to get there. The chart below plots both portfolios against our 21% target (green dotted line). The 3% portfolio (red line) has a smooth progression. Meanwhile, the 12% Portfolio (blue line) has a more erratic path.

But why should I care since I end up with the same return?
Volatility is called a risk measure because it is a critical factor in the risk of not achieving your target or losing money. Think about it in probability terms. In the chart above, which line is always the closest to the target? Thus, if you place yourself at any point during that period, which one has the highest probability of achieving your target?
Yes, the portfolio with the least volatility, which is less Risky.
The chart below shows the paths the 12% and 3% (in red) portfolios can take. The 12% portfolios have much more dispersed outcomes than the 3% portfolios.
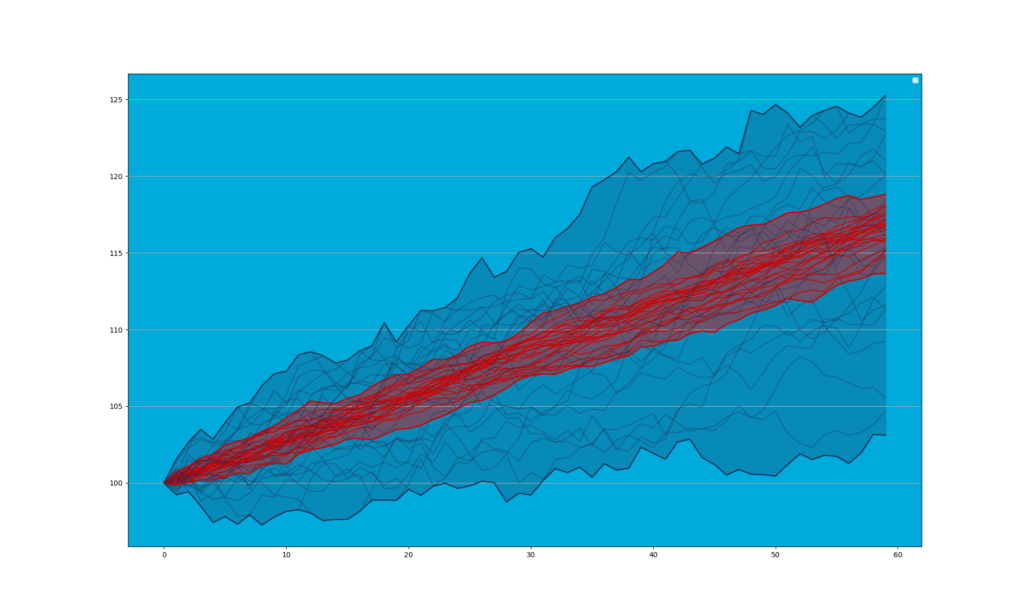
The portfolio with the least volatility is the best for the same return. It has the best risk-adjusted returns.
But is there a single measure that captures that superiority?
4) The first step for proper comparisons of Risk-Adjusted returns: the good ol’ Sharpe Ratio
The Sharpe Ratio measures an investment’s performance compared to a risk-free asset after adjusting for its volatility. Understanding how much excess return you receive for the extra volatility you endure for holding a riskier asset is valuable.
Simply put, it is the portfolio’s real return divided by its volatility. Formally, the real return should be the excess return above inflation. However, a proxy for the risk-free rate, or cash rate, is used as a starting point. Since you’re asking, here’s the formula.

The Sharpe Ratio was introduced in 1966 and is still widely used to evaluate an asset manager’s performance.
If the 3% portfolio had an annual return of 20% and a risk-free rate of 2%, its Sharpe would be 6. The 12% portfolio, with the same return, would have a Sharpe of 1.5. The higher the Sharpe, the better the risk-adjusted return.
Note that 6 is not a realistic Sharpe Ratio. For multi-asset portfolios, a Sharpe of 1 is already quite reasonable (depending on the period). It is a good relative indicator of asset managers’ efficiency as long as the same period is used for comparison. However, during negative periods, the Sharpe Ratio loses its relevance. Other measures may be used, like the Sortino ratio or a more sophisticated downside risk measure, such as Value at Risk, its cousin Expected Shortfall or the more sophisticated Omega ratio. All are worthy of a separate discussion.
Performance Watcher uses relative risk-adjusted measures as a key input for its private portfolio comparison metrics. In fund management, Morningstar assigns their well-known stars based on risk-adjusted returns.
Take away
Now, you understand the four keys to performance measurement!
We started by examining how performance is computed and realised that the methodology is not neutral. Daily time-weighted is the most relevant measure. Which one is presented in your manager’s or bank’s reporting?
We talked about the first letter in the Greek alphabet: Alpha. While “outperformance” is a simple concept, it is vital to find the right reference against which to compare your portfolio. Getting proper answers to explain differences may involve some ego management.
Then, we explained how to look at “Risk” or volatility: the probability of losing money over a given period. Once it’s calculated, what do you do with it?
Comparing your portfolio to a benchmark or another portfolio using risk-adjusted measures, like the Sharpe Ratio, allows you to evaluate how well your portfolio manager has applied your risk budget. This analysis needs to be combined with further tools, and your manager should be able to explain the difference…